


SAIB at a Glance
 |
Growing volume |
| 2019 SAR million |
2018 SAR million |
|
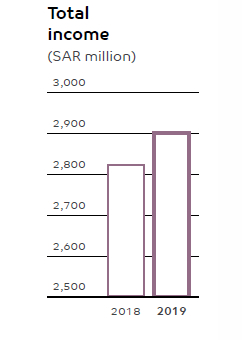
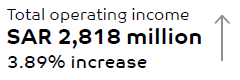
| Total income* | 2,906 | 2,824 |
| Total expenses** | 1,234 | 1,133 |
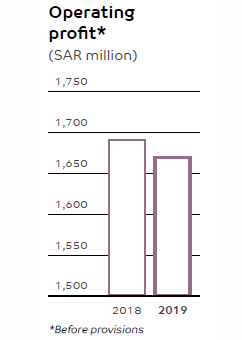
| Operating profit before provisions | 1,672 | 1,691 |
| Provisions for credit and other losses | 1,343 | 247 |
| Net Income | 239 | 576 |
| Provisions for Zakat and Income Tax*** | 90 | 868 |
| Loans and advances, net | 57,112 | 59,413 |
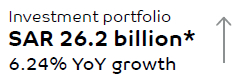
| Investments | 26,175 | 24,638 |
| Investments in associates | 994 | 1,012 |
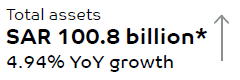
| Total assets | 100,815 | 96,070 |
| Term loans | 2,012 | 2,030 |
| Subordinated debt | – | 2,006 |
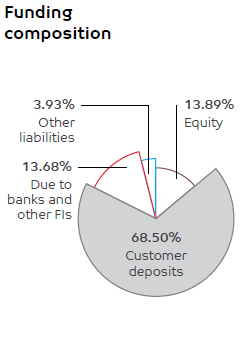
| Customer deposits | 69,058 | 63,690 |
| Shareholders’ equity | 12,007 | 11,621 |
| Tier I Sukuk | 2,000 | 1,785 |
| Total equity | 14,007 | 13,406 |
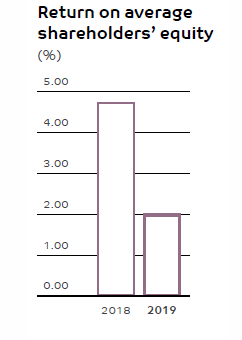
| Return on average shareholders’ equity (%) | 2.03 | 4.73 |
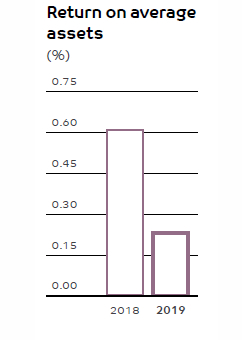
| Return on average assets | 0.24 | 0.61 |
| Capital adequacy (%) | 18.26 | 19.31 |
| Equity to total assets (%) | 13.89 | 13.95 |
* Total income includes total operating income plus share in earnings of associates.
** Total expense includes total operating expenses before impairment charges.
*** The years prior to 2018 have not been adjusted for provisions for Zakat and Income Tax.